Bridging data → decisions.
A data practice shaped around evidence, not noise.
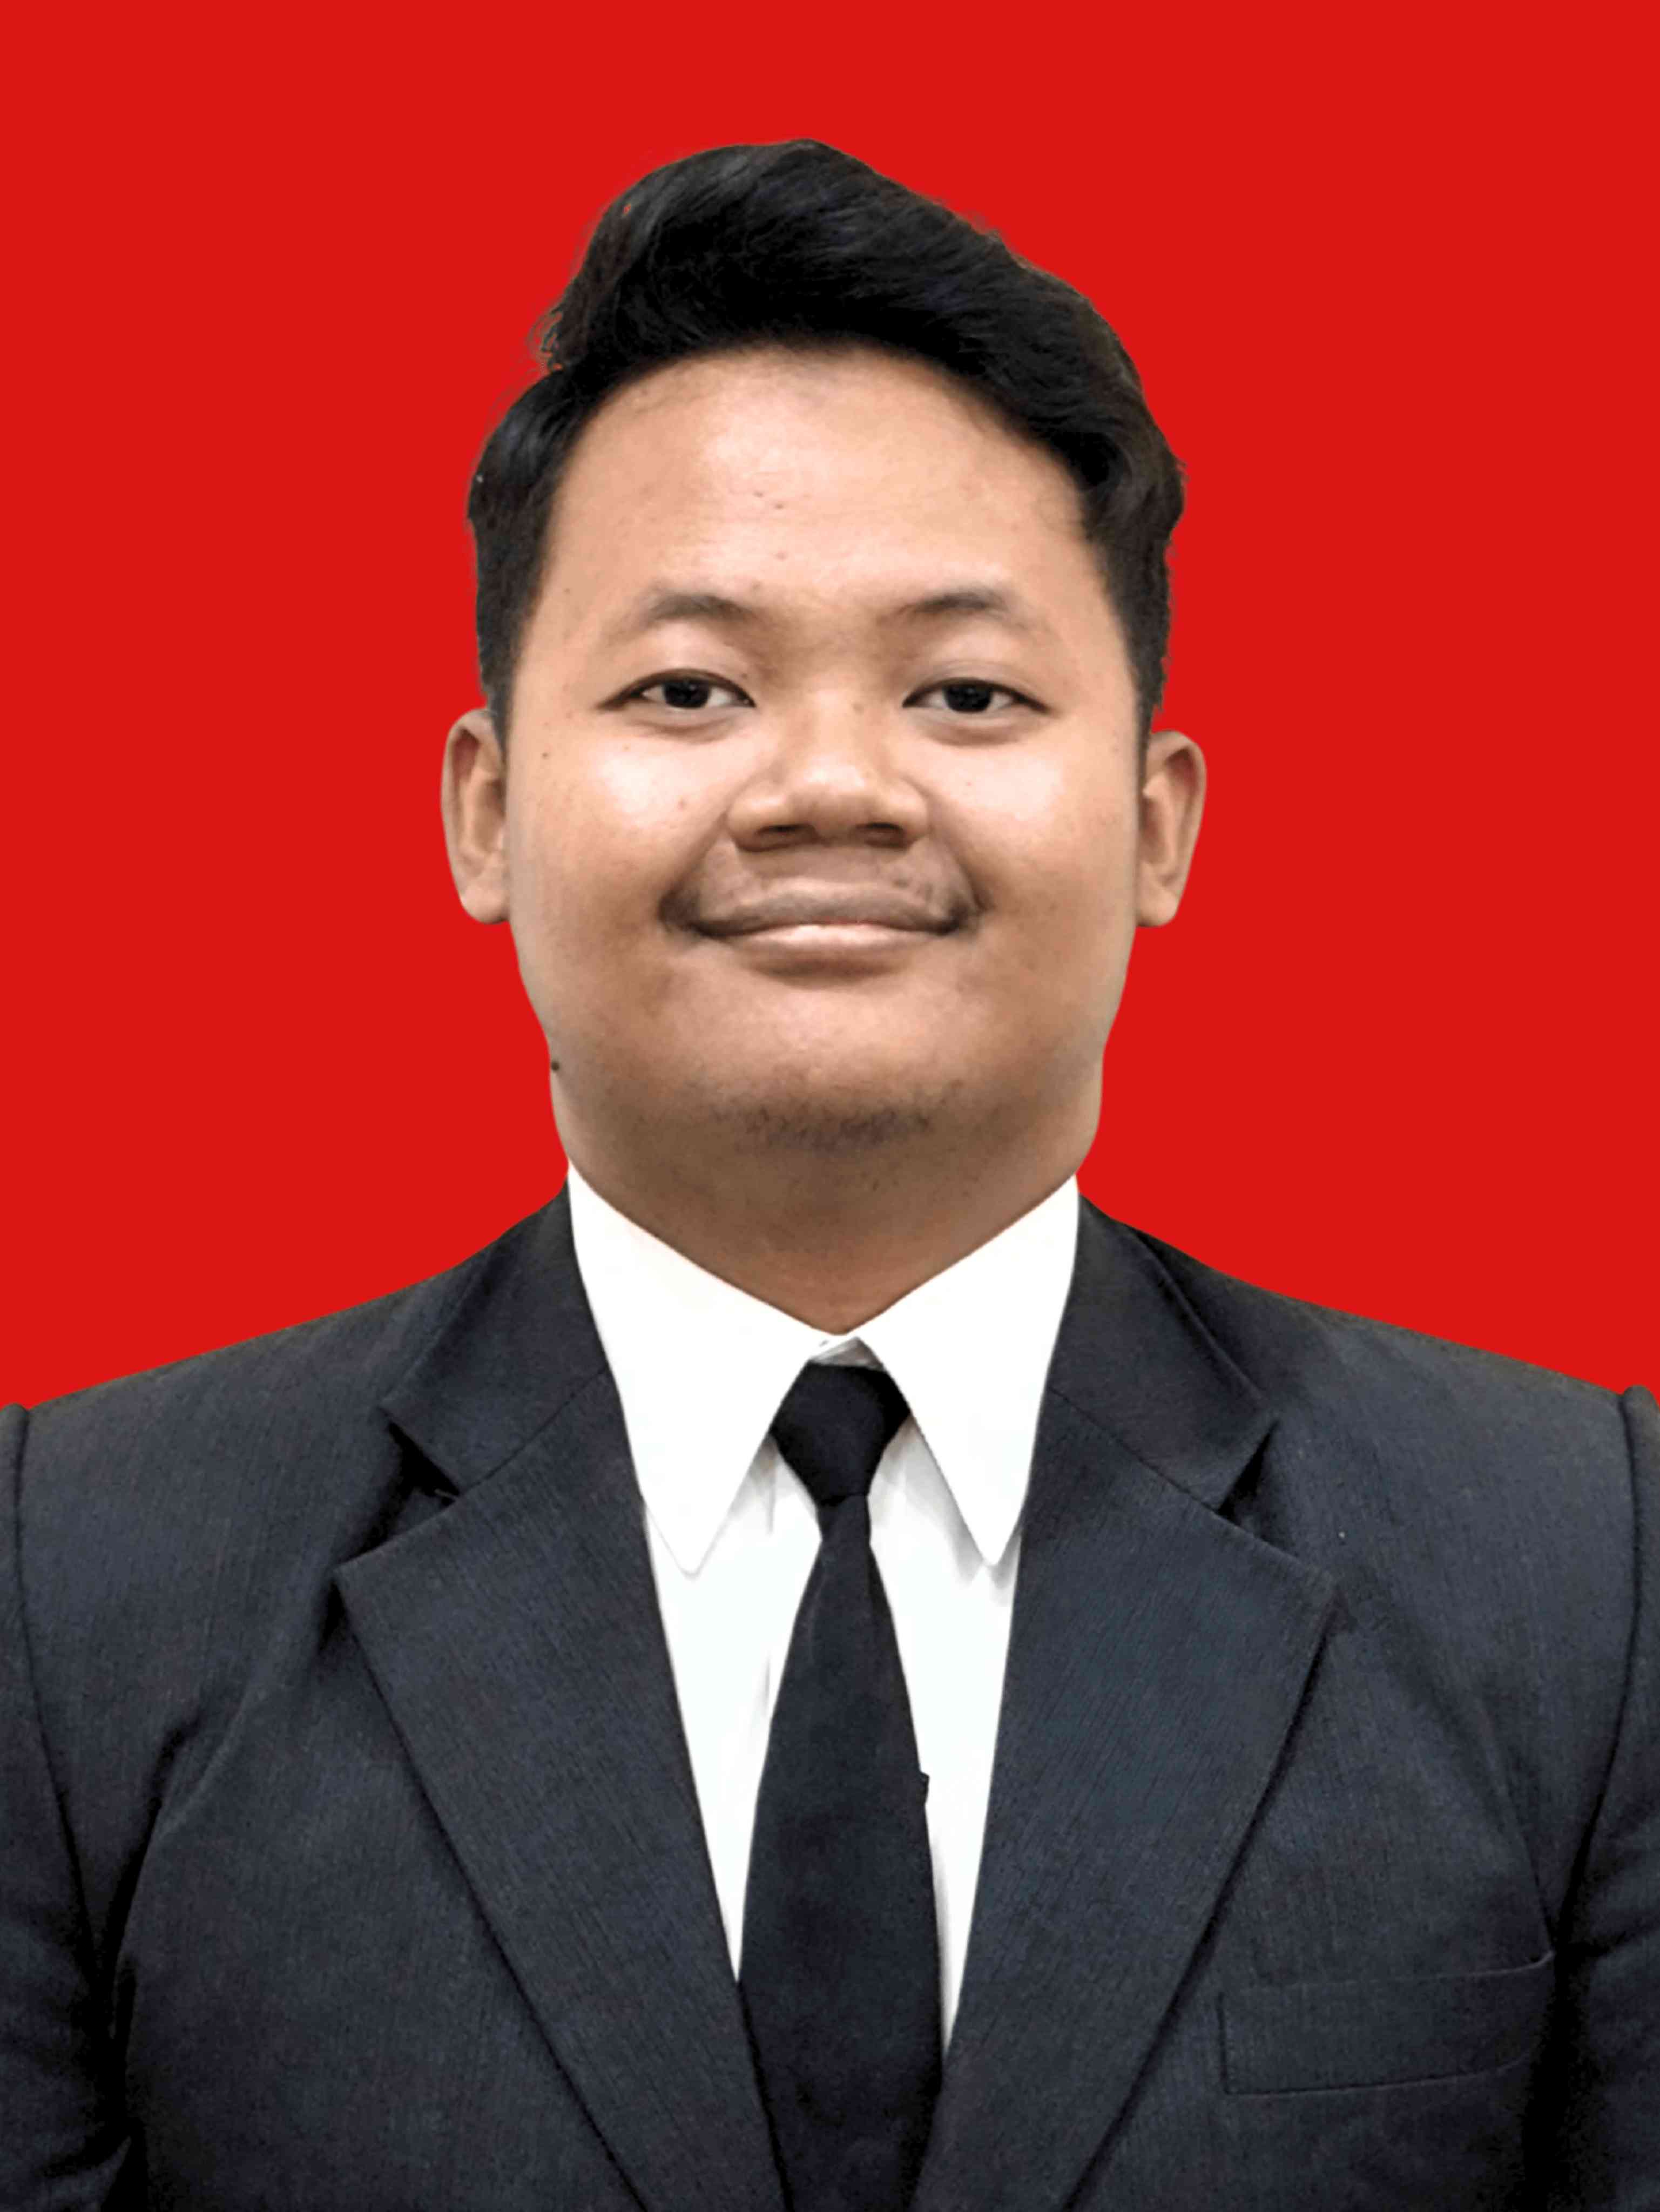
Muhamad Bintang RamadhanData &Business Analyst
Statistics graduate with hands-on experience across government, insurance, and automotive sectors. Skilled in Python, SQL, and Tableau, I specialize in geospatial mapping, sentiment analysis, and transforming complex datasets into clear, data-driven decisions.
Focus
Evidence -> outcome
Tools
Python . SQL . Tableau
Base
Statistics, UNS

Turning raw numbers into decisions that stick.
I am a passionate Statistics graduate from Universitas Sebelas Maret with hands-on experience transforming raw data into strategic insights across government, insurance, and automotive retail sectors.
From standardizing 140,000+ customer records for nationwide geospatial mapping and analyzing 1,800+ citizen complaints for government policy reports, to scraping and evaluating 5,000+ customer posts using LLM sentiment analysis, I bridge deep statistical rigor with modern AI tools.
With extensive experience in Python, SQL, Tableau, and Looker Studio — alongside a solid foundation in Minitab, SPSS, and RStudio — I focus on evidence-based problem solving, clear executive communication, and building scalable data solutions that drive real business outcomes.
Quick facts
- Education
- Universitas Sebelas Maret — Bachelor of Statistics (GPA: 3.56 / 4.00, Cum Laude)
- Specialization
- Data & Business Analysis
- Focus
- Python · SQL · Tableau · Looker Studio
- Relevant Coursework
- Regression Analysis, Time Series Analysis, Statistical Machine Learning, Data Exploration & Visualization, Database, Business Analytics, Computational Statistics
Work rooted in operational data.
Case work: from query to shipped.

InsCure Skin Disease Detection
A web-based Capstone project developed for Bangkit Academy, leveraging machine learning models to classify and detect skin diseases.

Retail Transaction Dashboard
Interactive sales transaction dashboard built with Google Looker Studio for real-time business monitoring and data-driven decision-making.

London Bikes Moving Average Dashboard
Interactive Tableau dashboard analyzing over 3.1 million bike rides in London with dynamic moving average visualization.

ULAS Report in Q3 2024
A comprehensive data analysis and official report compilation evaluating 1,800+ citizen complaints across Surakarta city services.

Sequis Customer Density & Macroeconomic Analysis
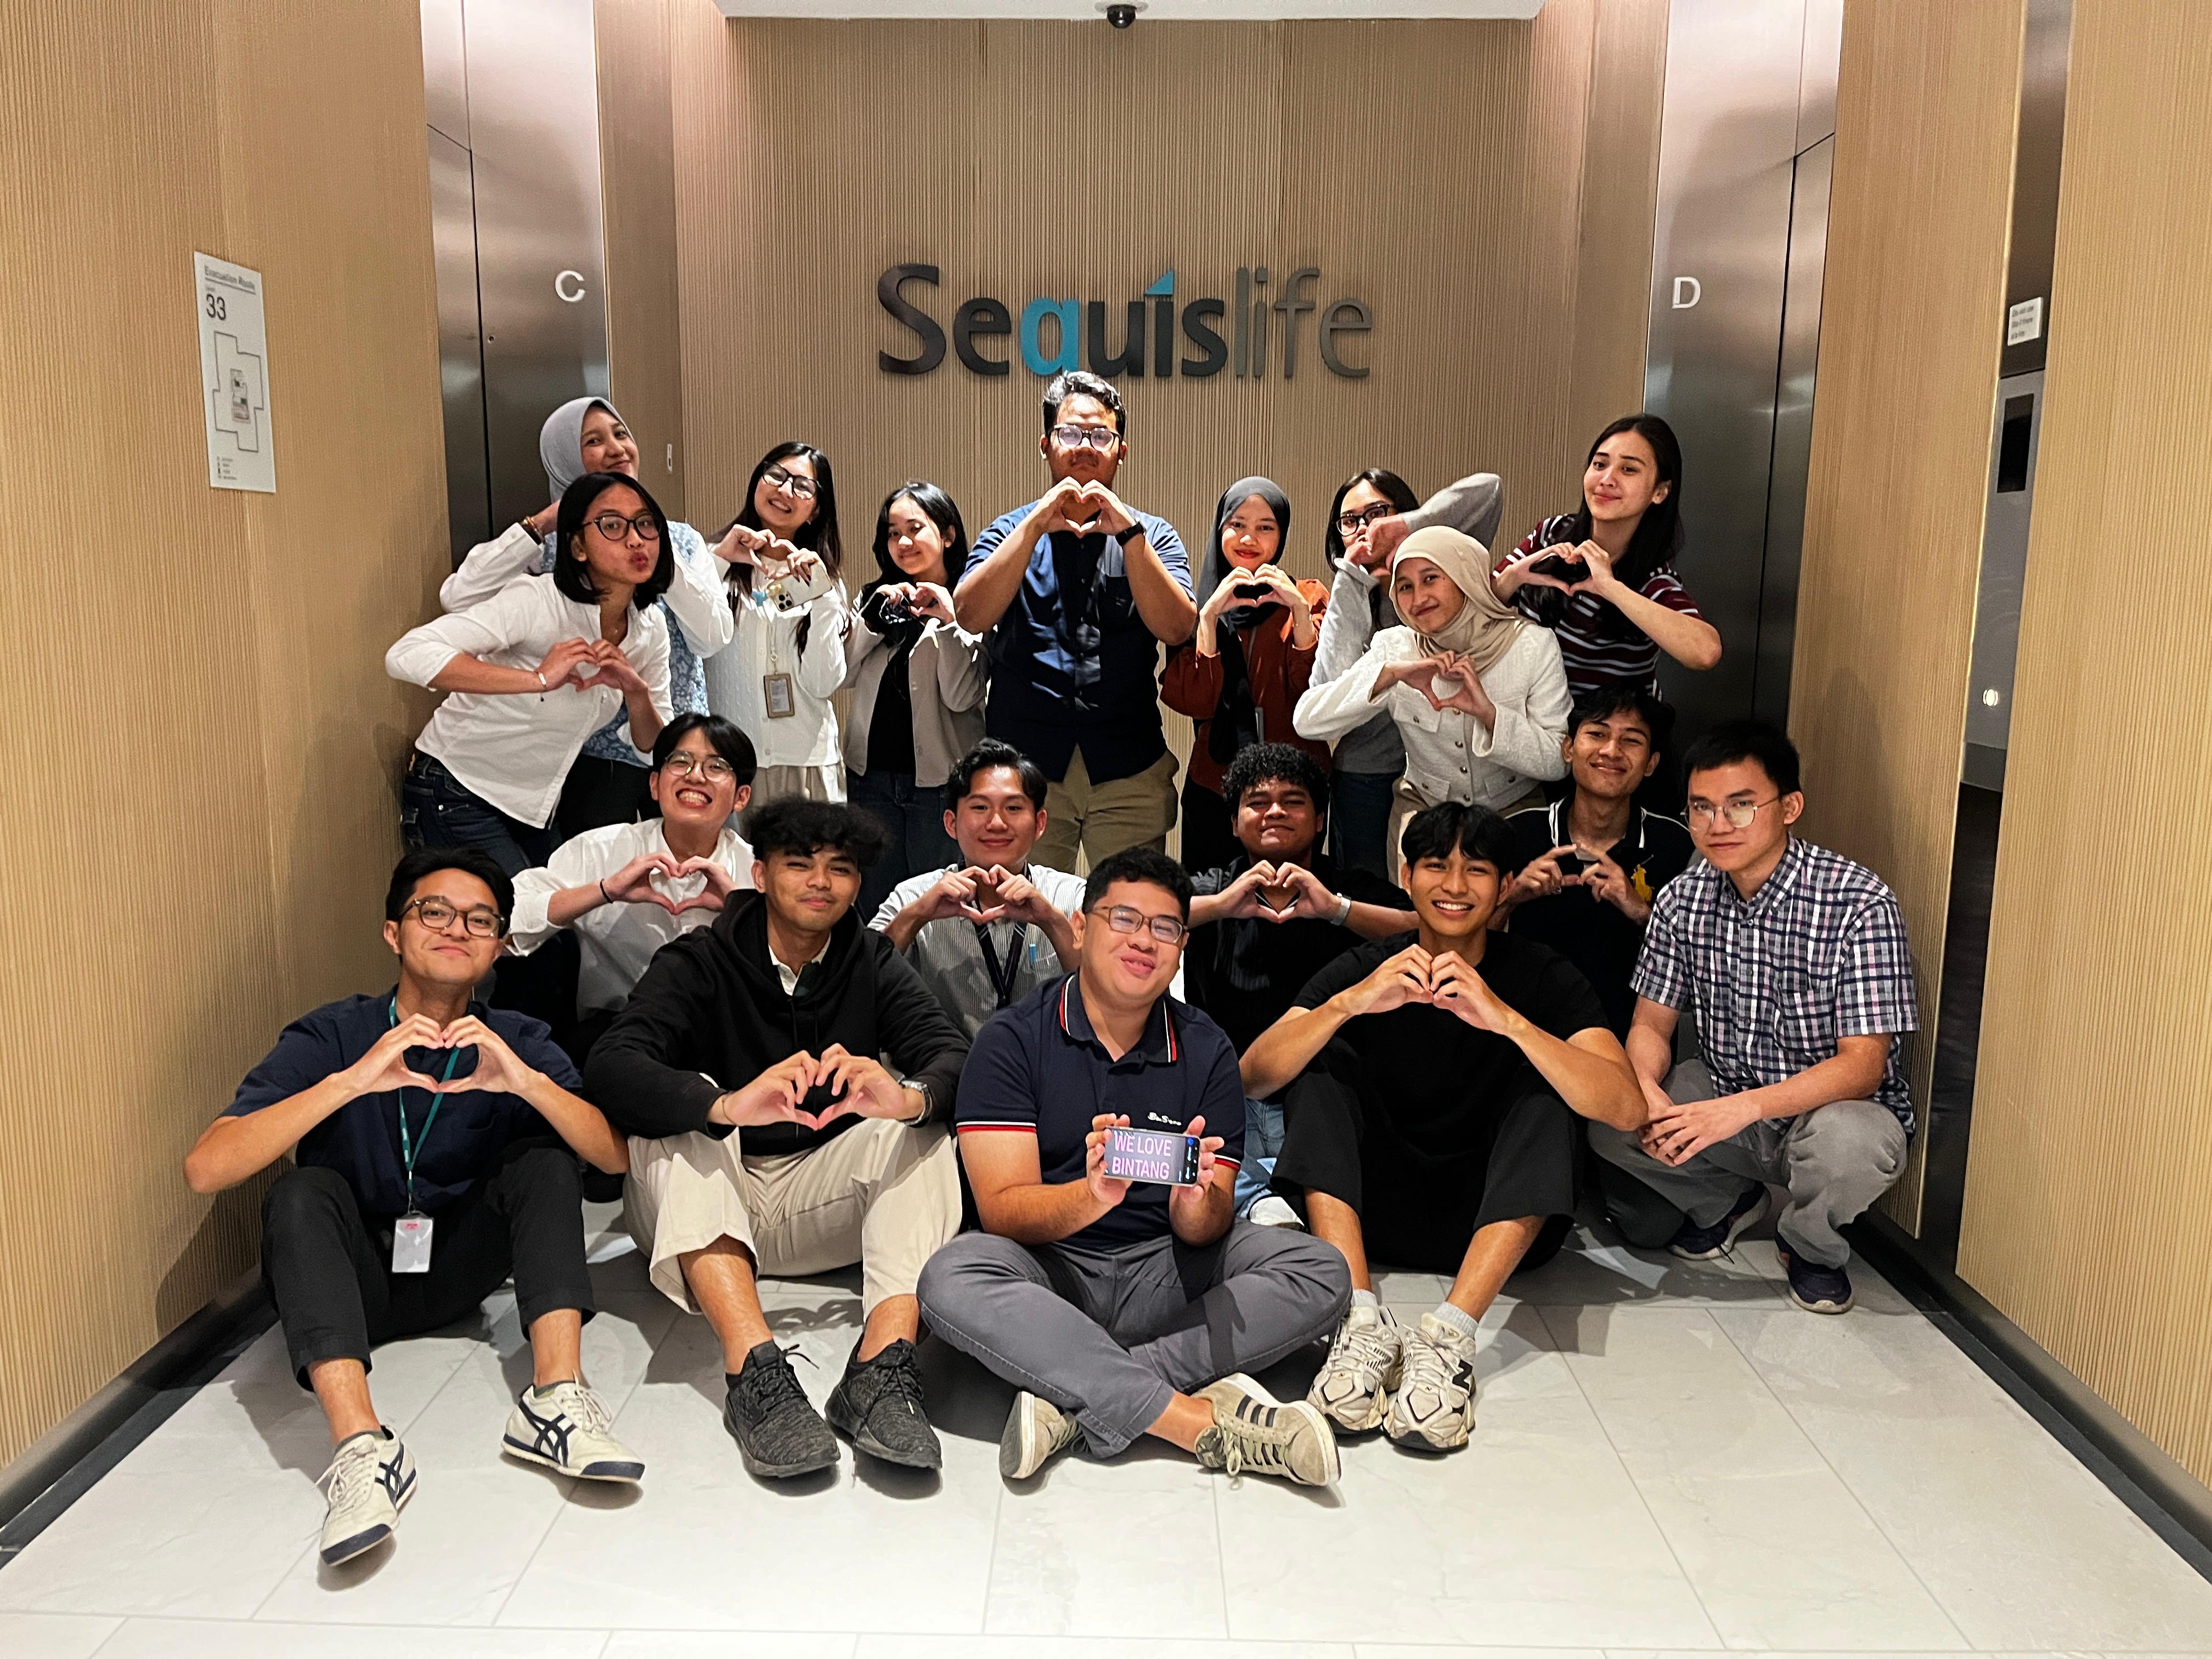
A replica of the customer data pipeline and analysis built during my internship at Sequis Life, handling macroeconomic data collection, fuzzy data matching for 140,000+ customer records, and spatial density mapping in Jabodetabek.

Bilingual Insurance RAG System
A Retrieval-Augmented Generation (RAG) system built from scratch in Python to query English insurance policy documents in Indonesian.
Toolkit oriented to readable analysis.
Technical
9Day-to-day analyst toolkit
Data & Analytics
6Modeling & AI methods
Professional
3How I work with teams
Recognition & proof of work.
Bangkit Academy 2024 Machine Learning Cohort
Selected among thousands of applicants for Google-supported Bangkit Academy 2024, completing 900+ hours of intensive Machine Learning training covering TensorFlow, model deployment, and end-to-end ML pipelines.
Official Diskominfo Surakarta Report Book (2024)
Recognized as a contributor to the official Diskominfo Surakarta Report Book 2024 for citizen complaint analysis work, transforming public feedback data into actionable policy insights.
Let's make
data useful.
Open to data analyst, business analyst, and insight ops roles. Fastest via email. I reply within a day.